


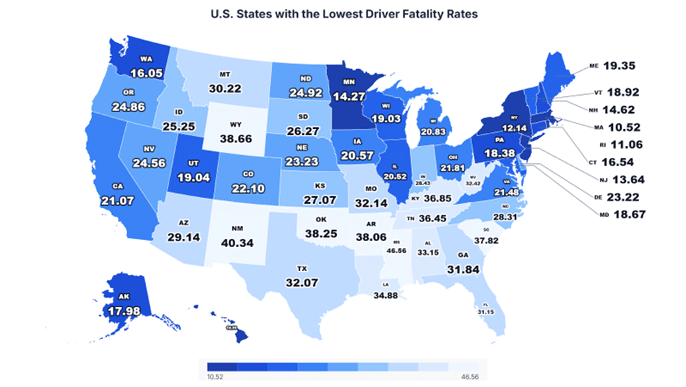
Driver safety across the United States is under renewed attention as a new study reveals the states where motorists face the lowest risk of fatal crashes. While traffic deaths remain a nationwide concern, the findings highlight clear differences in how effectively states protect drivers through road design, enforcement, and safety-focused policies.
The research conducted by DeHoyos Accident Attorneys analyzed driver fatality data from the CDAN Fatality Analysis Reporting System (FARS) across all 50 U.S. states from 2019 to 2023. The study measured Average Driver Fatalities per 100,000 Licensed Drivers, with lower numbers indicating safer driving conditions and fewer fatal incidents involving drivers.
|
Top 10 States With the Lowest Driver Fatality Rates (2019–2023) |
||
|
State |
Average Driver Fatality per 100,000 Licensed Drivers |
Rank |
|
Massachusetts |
10.52 |
1 |
|
Rhode Island |
11.06 |
2 |
|
New York |
12.14 |
3 |
|
New Jersey |
13.64 |
4 |
|
Minnesota |
14.27 |
5 |
|
Hawaii |
14.35 |
6 |
|
New Hampshire |
14.62 |
7 |
|
Washington |
16.05 |
8 |
|
Connecticut |
16.54 |
9 |
|
Alaska |
17.98 |
10 |
New York ranks third with an average of 12.14 driver fatalities per 100,000 licensed drivers, 52% lower than the national average of 25.18 driver fatalities per 100,000 licensed drivers. With 12,133,329 licensed drivers, the Empire State averaged 1,473 driver deaths annually between 2019 and 2023. Fatalities peaked in 2022 (1,599 deaths), and the lowest number was in 2019 (1,218 deaths).
Looking at the study, a spokesperson from DeHoyos Accident Attorneys commented:
“New York’s impressive performance is driven by reduced dependence on personal vehicles in major metropolitan areas and aggressive Vision Zero measures. High compliance with seat belt laws and targeted speed enforcement have also made a substantial difference. Addressing risks on suburban and rural roads will help strengthen its safety record further.”
What Drivers Should Know About Safer Roads
Traffic safety experts point to several shared characteristics among the safest states for drivers:
- Strong enforcement of impaired and distracted driving laws
- Well-maintained roadways and clearly marked lanes
- Robust driver education and licensing standards
- Public awareness campaigns promoting defensive driving
- Data-driven traffic safety planning and infrastructure investment
Methodology
The study was conducted by DeHoyos Accident Attorneys, a Houston-based personal injury law firm that represents clients in vehicle collisions, slip-and-fall disputes, dog bites, and wrongful death cases. The firm, led by Ryan A. DeHoyos, prioritizes client care, aggressive advocacy, and maximizing compensation across Greater Houston.
The study analyzed driver fatality data across all 50 U.S. states between 2019 and 2023, sourced from the CDAN Fatality Analysis Reporting System (FARS). It measured Average Driver Fatalities per 100,000 Licensed Drivers to identify where motorists face the lowest per-capita risk of fatal accidents. Lower numbers indicate safer driving conditions relative to the number of licensed drivers.
Data Source
- Driver Fatality Data: https://cdan.dot.gov/query
- Research Dataset: https://docs.google.com/spreadsheets/d/1zrFYPsQ1RObQ8SsXTRrudAMYEILD7lL4qbaqAT-ViJA/edit?gid=0#gid=0
Study by: https://www.dehoyosinjury.com/